

Why Environmental Stability Is a Daily Engineering Problem, Not a One-Time Setup
Cleanrooms, cold storage areas, pharmaceutical warehouses, and precision laboratories all share one quiet vulnerability: conditions drift. A compressor cycles slightly out of tolerance, a door is left open for ninety seconds too long, or a sensor probe drifts after months of continuous service. None of these events are dramatic on their own, yet each can compromise product integrity, invalidate a batch, or trigger a compliance failure that surfaces weeks later during an audit.
Facilities that rely on manual spot-checks are working with sparse data. A technician who records temperature every four hours captures only six data points across a full day, leaving eighteen hours of blind spots. Automated environmental monitoring closes that gap by sampling continuously, flagging deviations the moment they happen rather than the next time someone walks the floor with a clipboard.
A facility running continuous digital logging typically detects out-of-range excursions within minutes, compared with hours or even a full shift under manual rounds.
How Wireless Humidity Sensors Fit Into a Cleanroom Control Strategy
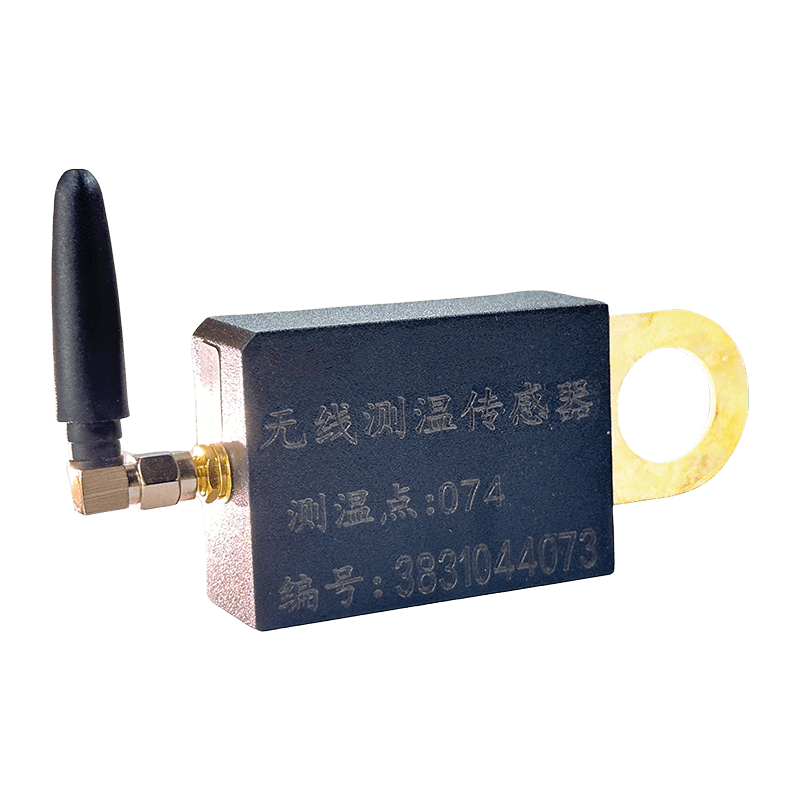
Humidity control is often the harder half of the equation. Temperature swings are usually slow and predictable, but relative humidity can shift quickly with occupancy, door cycles, or process equipment such as autoclaves and washers. Wired hygrometers work, but running cable through a certified cleanroom envelope means penetrations, gaskets, and additional validation work every time a sensor moves.
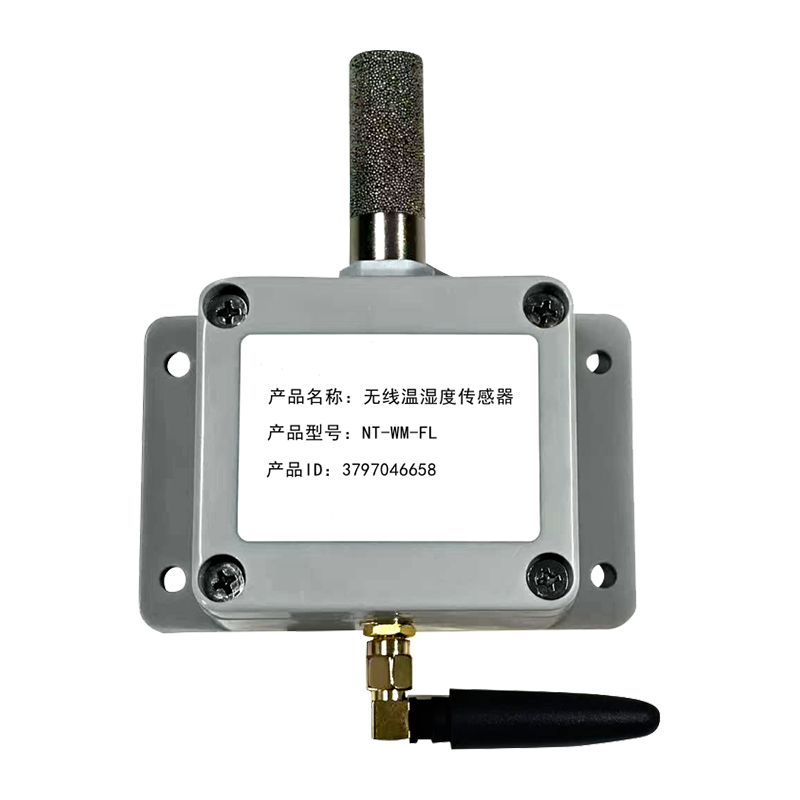
wireless and wi-fi humidity sensors avoid that entirely. Because they communicate over a facility Wi-Fi network rather than a dedicated cable run, they can be repositioned as a room layout changes without reopening the ceiling grid or wall panel. This matters more than it sounds: a 2023 industry survey of controlled environment operators found that layout changes were among the top three reasons monitoring points became inaccurate over time, simply because moving a wired probe was too disruptive to justify.
Practical Advantages of Wireless Deployment
- Sensors can be added to new monitoring points without new cable runs or wall penetrations
- Battery or low-power operation reduces the number of fixed power drops required in a sterile zone
- Calibration swaps take minutes since a replacement unit only needs to join the same network
- Data transmits at set intervals, typically every one to five minutes, supporting near real time trend review
Where Placement Actually Matters
Humidity does not behave uniformly across a room. Air near a supply diffuser reads differently than air near a return grille, and a corner behind equipment can trap moisture that a central sensor never detects. A short placement checklist helps avoid blind spots:
| Zone | Risk Factor | Recommended Sensor Density |
|---|---|---|
| Near entry doors | Frequent air exchange | One sensor per doorway zone |
| Equipment clusters | Localized heat and moisture output | One sensor within two meters |
| Open floor area | General drift over time | One sensor per fifty square meters |
| Storage racks | Uneven airflow between shelves | One sensor per rack tier |
What a Guide Rail Temperature Measurement Main Unit Adds to a Distributed Network
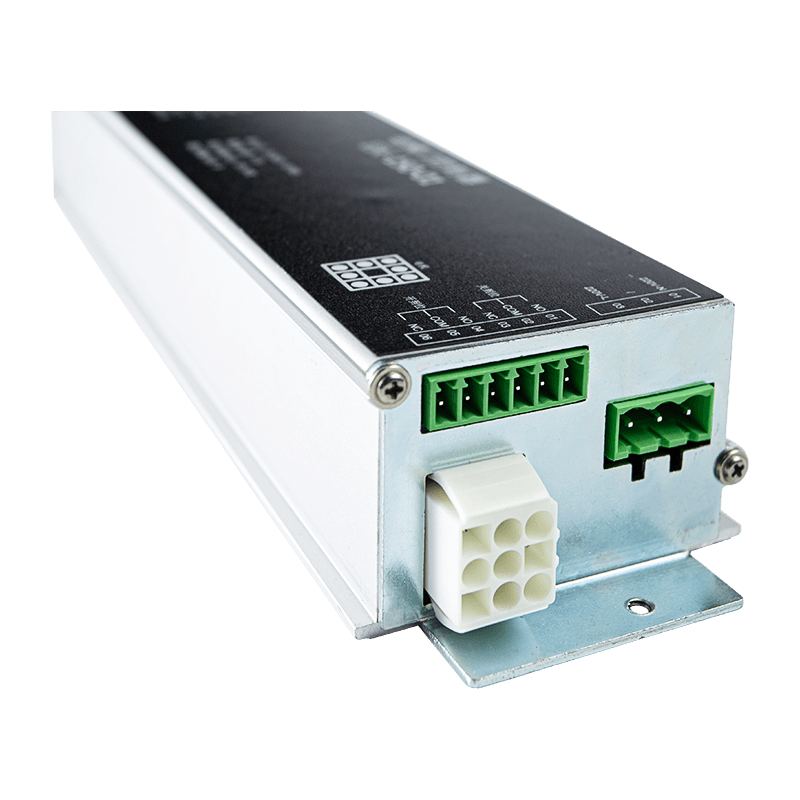
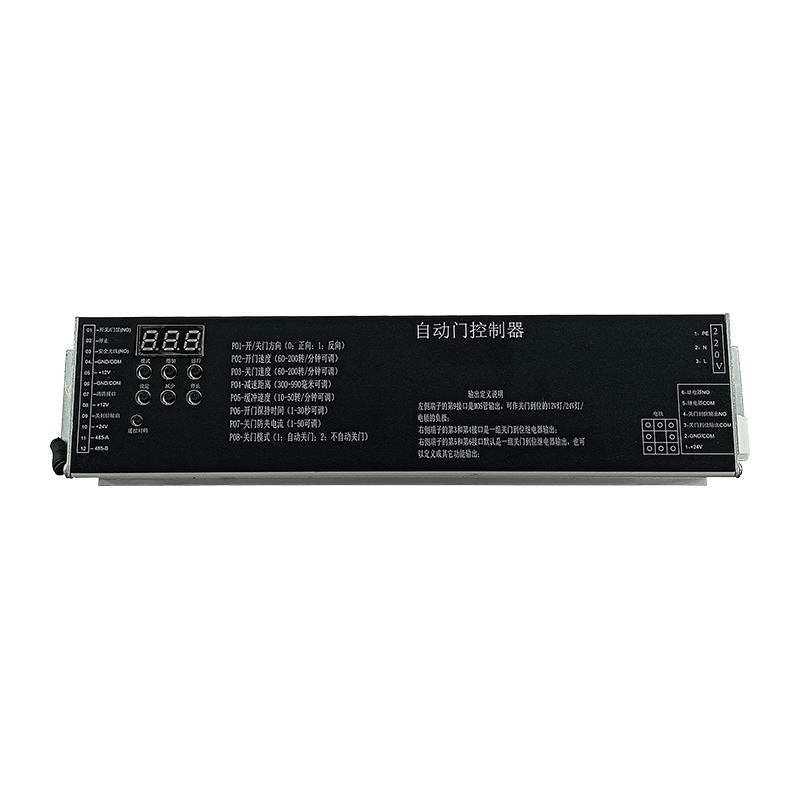
Sensors are only half of a monitoring system. Every reading has to be aggregated, timestamped, and compared against a threshold somewhere, and doing that reliably at scale requires dedicated hardware rather than a spreadsheet macro. This is the role of a guide rail temperature measurement main unit, a DIN-rail mounted host built to sit inside an electrical cabinet alongside other control equipment.
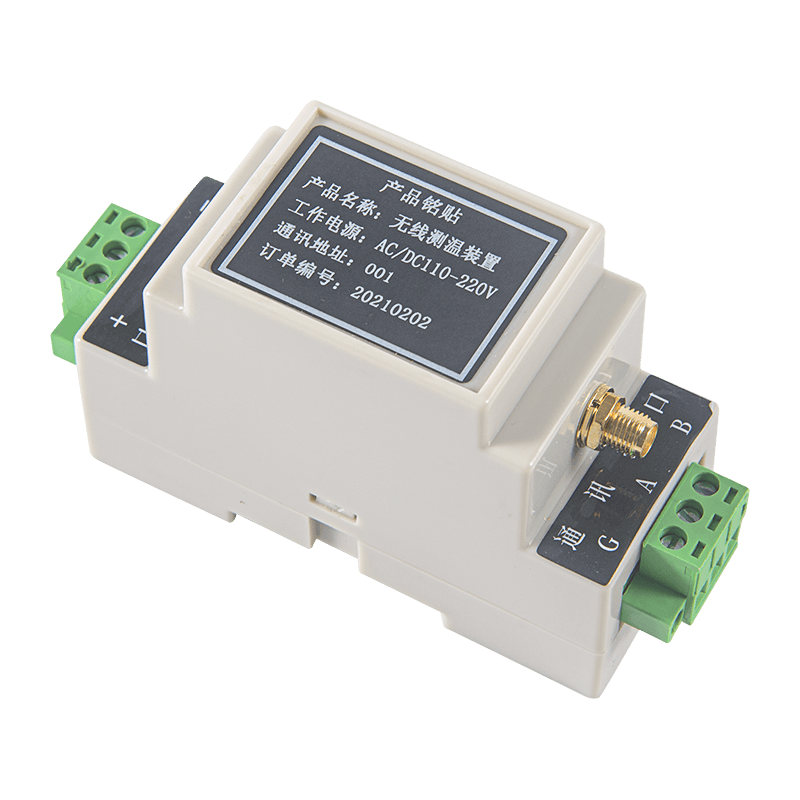
Because it mounts on a standard rail, it integrates into an existing electrical enclosure without a custom bracket or extra panel space, which matters in facilities where cabinet real estate is already tight. The unit typically handles channel aggregation from multiple wireless points, local alarm relay output for tripping an audible signal, and a data uplink to a central server or cloud platform.
Core Functions of a Rail-Mounted Monitoring Host
| Function | Practical Benefit |
|---|---|
| Multi-channel data aggregation | Consolidates readings from dozens of sensor points into one log stream |
| Local alarm relay | Triggers a physical alert even if network connectivity is temporarily lost |
| Buffered data storage | Retains readings during a network outage and syncs once connectivity returns |
| Standardized mounting | Fits directly into existing DIN-rail electrical cabinets |
This buffering behavior is worth emphasizing. A monitoring system that only stores data in the cloud loses its entire record during an outage. A guide rail host with local memory keeps logging locally and backfills the cloud database once the connection restores, which is the difference between a complete audit trail and a data gap that raises questions during a compliance review.
Why On-Site Visibility Still Matters in a Cloud-Connected Facility
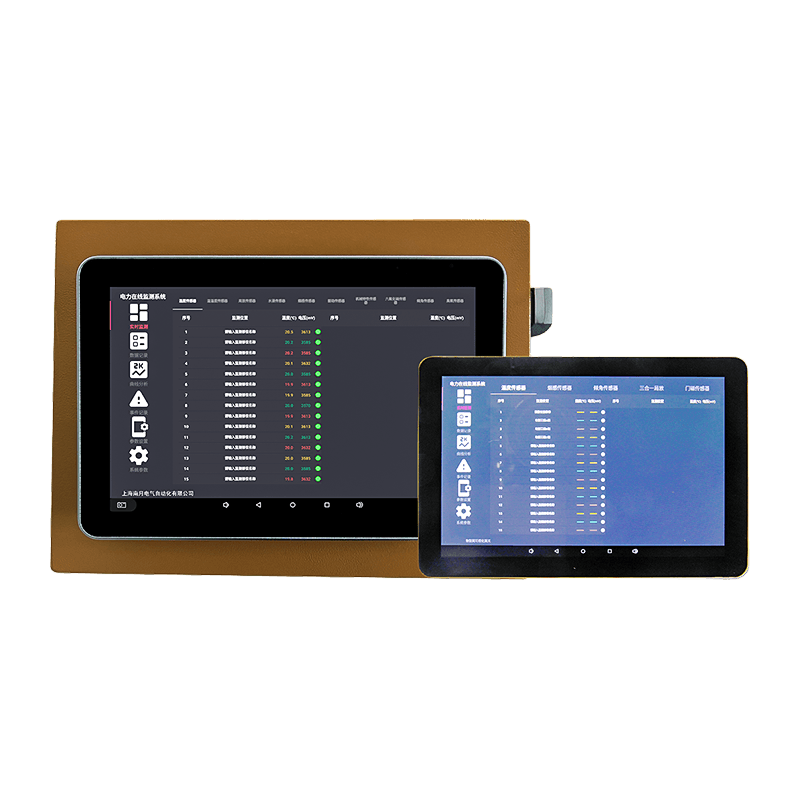
Remote dashboards are convenient, but they are not always the fastest way for staff physically present in a room to confirm current conditions. A small color screen wireless temperature measurement host puts live readings directly at the point of use, letting a technician glance at a wall-mounted display instead of pulling out a phone or walking to a workstation.
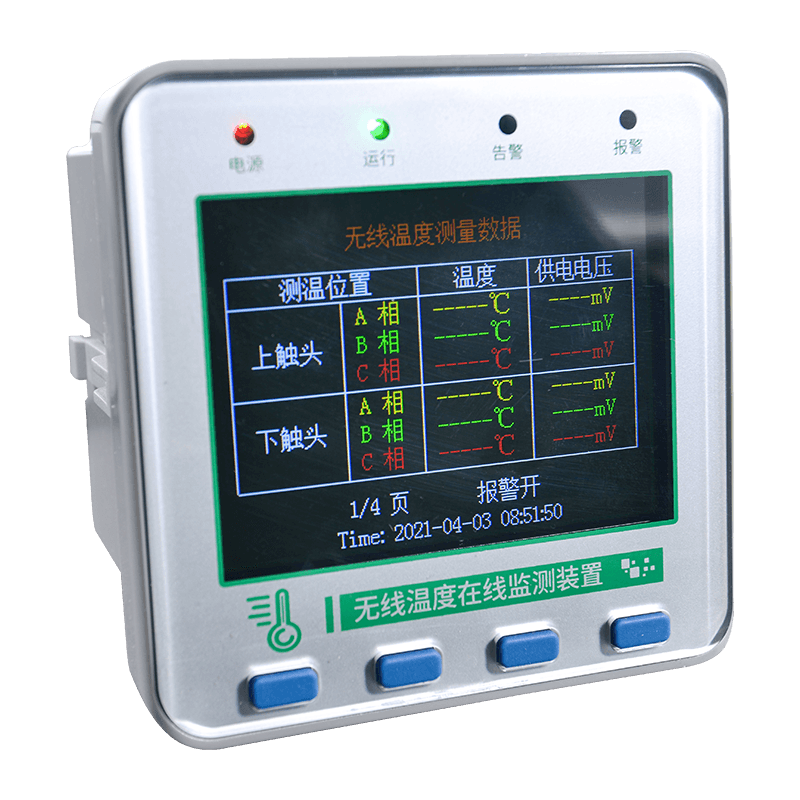
This kind of local display also plays a training role. New staff learn what normal readings look like for a given room over time simply by walking past the display during routine work, building an intuitive sense of the space that a phone app buried in a folder of icons rarely provides.
How the Pieces Connect: A Cloud Based Environmental Monitoring Architecture
Individually, sensors, rail-mounted hosts, and local displays each solve one problem. Connected together through a shared platform, they form a cloud based environmental monitoring system capable of covering an entire facility from a single interface, while still functioning locally if the internet connection drops.
The flow above illustrates a layered design principle: sensors capture raw conditions, the rail-mounted host aggregates and buffers that data locally so nothing is lost during an outage, and the cloud platform handles longer-term trend analysis, alert routing, and report generation for audits. Staff can interact with the system at any layer, whether that means glancing at a wall display or reviewing a monthly trend chart from a phone.
Manual Rounds Versus Automated Remote Monitoring: A Direct Comparison
Facilities weighing whether to invest in a monitoring upgrade often want a side-by-side view of what actually changes in daily operation. The table below breaks down the practical differences rather than abstract claims.
| Factor | Manual Spot-Checks | Automated Remote Monitoring |
|---|---|---|
| Sampling frequency | Every two to four hours | Every one to five minutes |
| Excursion detection time | Up to several hours | Typically under five minutes |
| Record completeness | Gaps between rounds | Continuous timestamped log |
| Staff time required | Recurring walk-throughs daily | Exception-based review only |
| Audit readiness | Manual log compilation | Automated exportable reports |
The pattern that stands out is not just speed, it is coverage. A manual round only tells you the room was in range at the moment someone checked it; a continuous system tells you whether it stayed in range for every minute in between, which is precisely the question an auditor or a quality manager actually needs answered.
Rolling Out a Remote Environmental Monitoring Solution Without Disrupting Operations
Facilities already running production or research activity cannot simply pause for a monitoring overhaul. A phased rollout keeps disruption to a minimum while still reaching full coverage.
- Map the facility and identify zones with the highest sensitivity to temperature or humidity drift
- Install wireless sensors in those priority zones first, confirming network signal strength at each point
- Mount the rail-based host in the nearest available electrical cabinet and connect it to the facility network
- Add local color display units at high-traffic checkpoints where staff need immediate visual confirmation
- Configure alert thresholds based on historical data rather than generic defaults
- Expand sensor coverage to secondary zones once the primary rollout is validated
Setting Alarm Thresholds That Actually Work
A common early mistake is copying threshold values from a specification sheet instead of building them around a room's real behavior. A shipping dock door that opens twenty times a day will show brief, expected humidity spikes that are not failures. Thresholds set too tight generate alarm fatigue, where staff begin ignoring alerts because most of them are false positives. A more workable approach ties alarms to sustained deviation over a set duration, such as five consecutive minutes out of range, rather than a single instantaneous reading.
Systems that use duration-based alarm logic instead of instant thresholds report meaningfully fewer false alerts, which keeps staff responsive when a genuine excursion occurs.
Frequently Asked Questions
Q1: How often should wireless sensors transmit data in a cleanroom setting?
Most controlled environments use a transmission interval between one and five minutes. Faster intervals improve excursion detection but increase network and battery load, so the right interval usually depends on how quickly conditions in that specific zone can drift.
Q2: What happens to data if the network connection goes down?
A rail-mounted main unit with local buffering continues logging readings even without connectivity, then synchronizes the stored data to the cloud platform once the connection is restored, preventing gaps in the audit trail.
Q3: Do wireless sensors need to be recalibrated as often as wired ones?
Calibration intervals are generally determined by sensor type and application rather than connection method, but wireless units are typically faster to swap during calibration since there is no cable to disconnect and reroute.
Q4: Can a monitoring system cover multiple rooms from one platform?
Yes. A cloud based architecture is designed to aggregate data from multiple rail-mounted hosts across different rooms or buildings into a single dashboard, which is one of the main advantages over isolated, room-by-room logging.
Q5: Is a local display necessary if staff already have dashboard access on their phones?
It is not strictly necessary, but a local display reduces the friction of checking conditions during routine work and gives staff an at-a-glance reference without needing to open an app or log in.